Week 2 - Visualizing data
Data visualization and interpretation of graphical information 📊
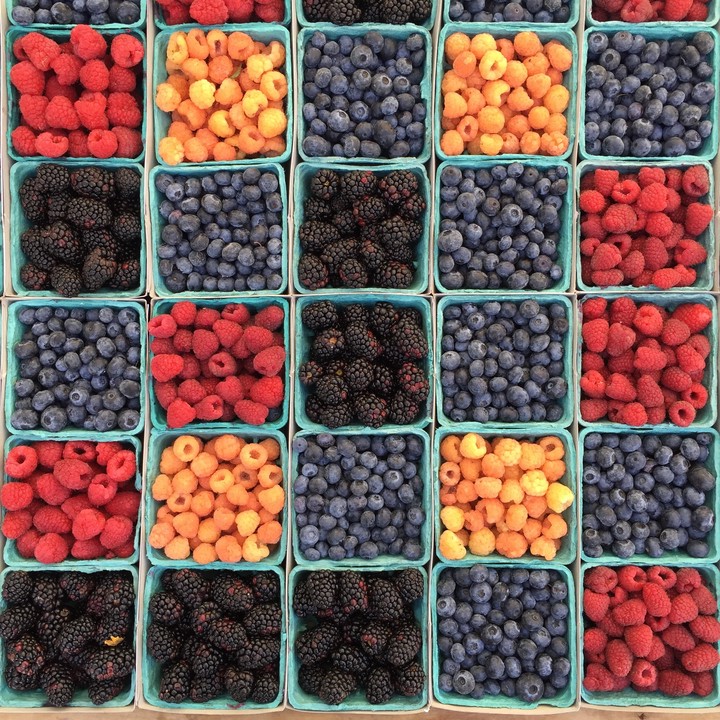
 Berries. Photo by William Felker on Unsplash
Tasks
- Watch the videos
- Complete the readings
- Complete the assignments
- If you haven’t yet done so:
- Complete the Getting to Know you survey on lyceum.
- Check out the Extra Credit opportunity.
Videos
You can access the course videos on YouTube. You can also find a playlists for all course videos on YouTube here.
No. |
Title |
YouTube |
Slides |
Length |
|
|---|---|---|---|---|---|
| 01 | Data and visualization | 23:52 | |||
| 02 | Visualizing data with ggplot2 | 21:40 | |||
| 03 | Visualizing numerical data | 23:57 | |||
| 04 | Visualizing categorical data | 6:28 |
Class Activities
Activity |
Title |
Date |
|---|---|---|
| Review | Data Visualization: Going further with ggplot2 | Tue, 25 Jan |
| Lab 2 | Plastic waste | Thu, 27 Jan |
Assignments
Assignment |
Title |
Due |
|---|---|---|
| Due this week | ||
| Lab 01 | Hello DCS! | Wed, 26 Jan, 23:59 EST |
| HW 01 | Pet names | Fri, 28 Jan, 23:59 EST |
| Q 01 | Visualizing Data | Sun, 30 Jan, 23:59 EST |
| EC | Extra credit | Contact X to sign up |
| Due next week | ||
| Lab 02 | Plastic waste | Wed, 2 Feb, 23:59 EST |
| HW 02 | Airbnb Listings Edinburgh | Fri, 4 Feb, 23:59 EST |
| Q 02 | Data wrangling | Sun, 6 Feb, 23:59 EST |
If you’re having difficulty accessing your HW or Lab repo, see troubleshooting advice here.
Readings
| 📖 | R4DS::Chp 3 - Data visualisation | Required |
| 📖 | IMS::Chp 2 - Exploratory Data Analysis | Required |
| 📄 | Make a plot | Optional |
| 📊 | Information is beautiful - COVID-19 data visualisations | Optional |
| 📊 | Wealth shown to scale | Optional |
| 📊 | Explore COVID-19 Symptoms Search Trends | Optional |
| 📊 | ggplot2 FAQs | Optional |
Code-along
The data come from TidyTuesday. TidyTuesday is a weekly social data project for the R community. Read more about TidyTuesday here.
You can find starter code for this session on RStudio Cloud, in the project titled Code Along 01 - Himalayan Climbers.
Interactive R tutorials
The following are interactive R tutorials, designed to give you more practice with R. These are optional, but the “Airbnb listings in Edinburgh” dataset show up in your next homework assignment as well, so you might want to go through that one so that you can gain familiarity with it. If you’re struggling with any of the topics covered this week, we strongly recommend you work through the second tutorial as well.
| Airbnb listings in Edinburgh | Related to HW 02 |
| Data Visualization Basics | Extra practice |